50 Solar Energy Facts, Statistics and Charts [2018 update]
Get a complete overview of the rise of Solar EnergySolar energy is going through a surge in adoption right now. Solar energy is red hot. But do you really know how big solar energy really is, how fast it is growing and how big its impact is?
This page will give you a complete overview of the key solar energy facts, facts and charts you need to know in 2018.
Categories
Solar Energy Installed Capacity
Solar Energy Generation
Solar Energy Cost
Solar Energy Jobs
Solar Energy Investments
Solar Energy Companies
Solar Energy Installed Capacity

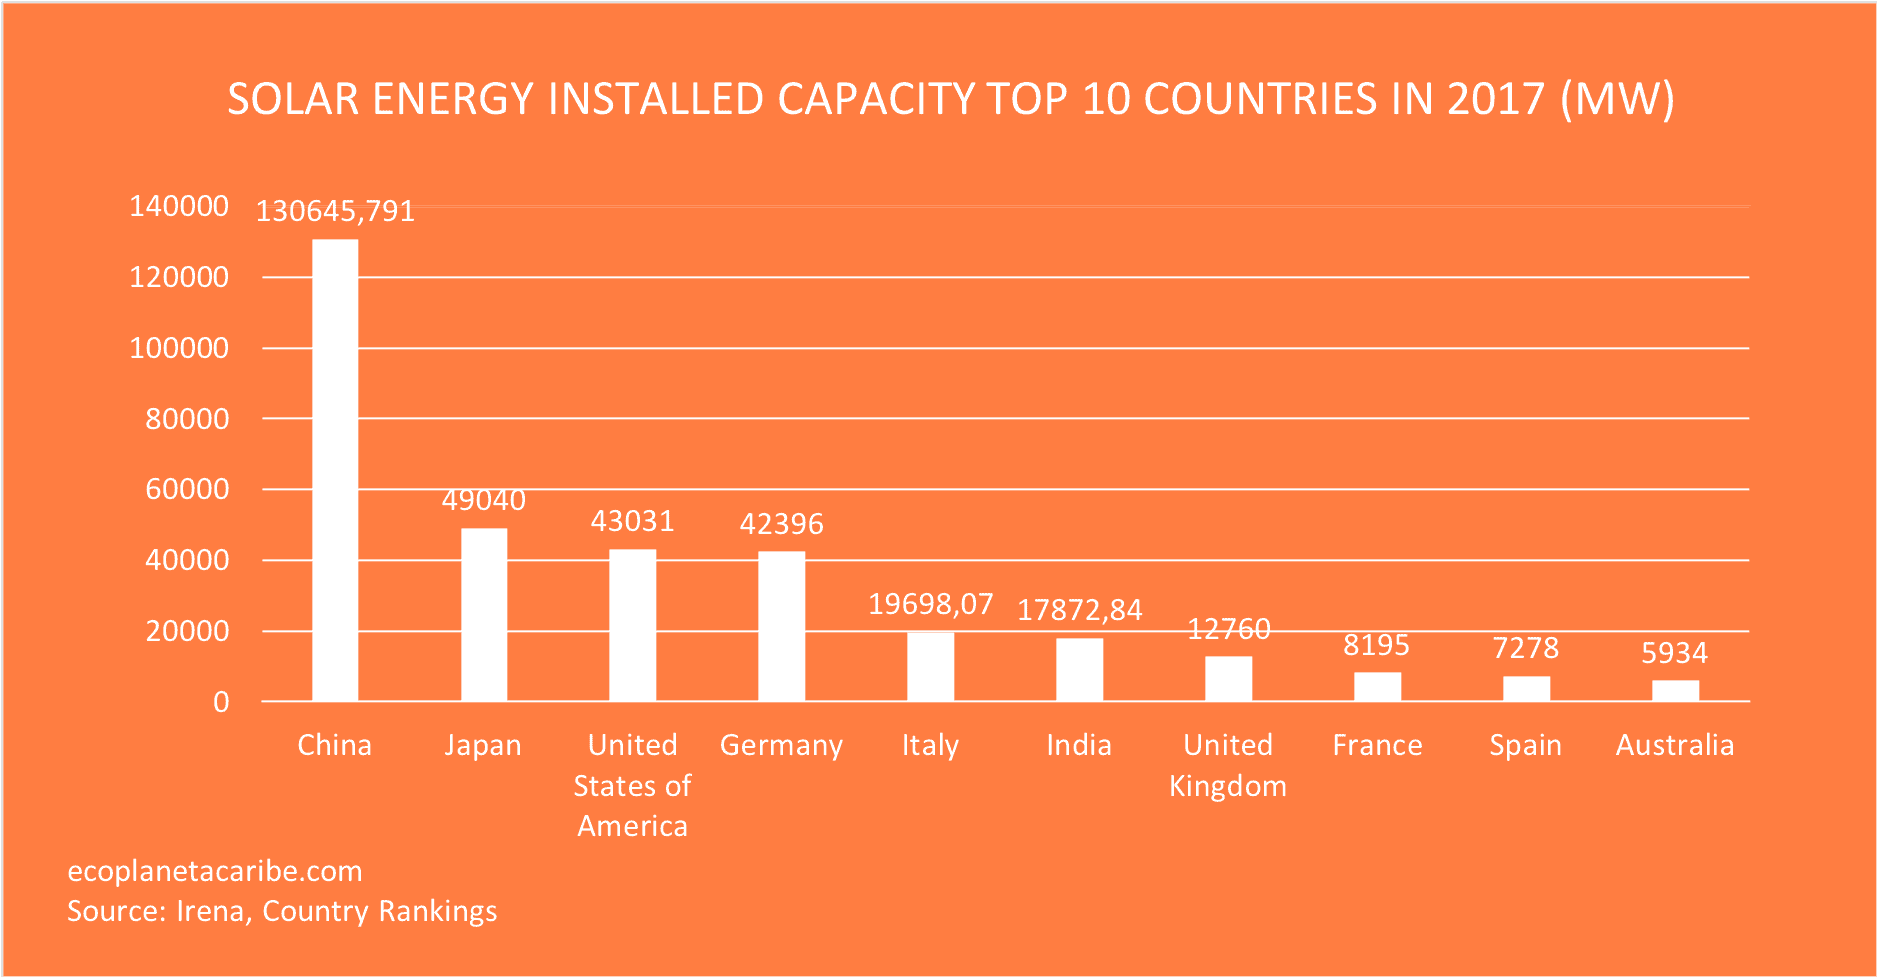
2. In 2017 China was the world leader in solar energy with 130 646 Megawatt installed capacity. That is more than Japan and the United States, the numbers 2 and 3.
3. In 2017 Target was the leading corporation in solar energy in the United States. It has an installed capacity of 203 Megawatt.

4. In 2017 82% of the global solar energy market was located in the United States, India, China and Japan [Greentech Media].
5. The 9 000 kilowatt Indianapolis Motor Speedway solar energy plant is the biggest of all the stadiums and sport venue's in the world [Solar Asset Management Europe].
6. The biggest solar park in the world is the Pavagada Solar Park located in India. It has a size of 2000 Megawatt [Power Technology].
7. In 2016 5% of all installed energy capacity in China was solar energy [International Energy Agency].
8. In 2017 China installed 53.1 GW of solar PV. That is more than was installed in 2015 world wide (51GW) [REN21].
9. In 2017 Europe installed 6.5 GW of solar PV [International Energy Agency].
10. In 2017 the United States 10.6 GW of solar PV, second behind China [International Energy Agency].
11. In 2017 California was the leading state in the the United States with 5.2 GW of installed solar energy capacity [International Energy Agency].
12. In 2017 29 countries had installed cumulative 1 GW or more of solar energy [REN21].
13. In 2017 8 countries had installed 1 GW or more of solar energy [International Energy Agency].
14. In 207 Honduras, Germany, Greece, Italy and Japan had enough PV capacity to theoretically produce
more than 5% of their annual electricity demand with solar PV. [International Energy Agency].
15. In 2017 the world installed 98 GW of solar PV [International Energy Agency].
Solar Energy Generation
17. The UK produced a record breaking 533 gigawatt-hours of energy, the highest weekly output measured in the UK [Greentech Media].
18. In July 2018 Germany produced a record breaking 6.17 terawatt-hours of production, a new monthly record [Greentech Media].
19. In 2017 1.3% of all energy in the United States was produced with solar energy [US Energy Information Administration].
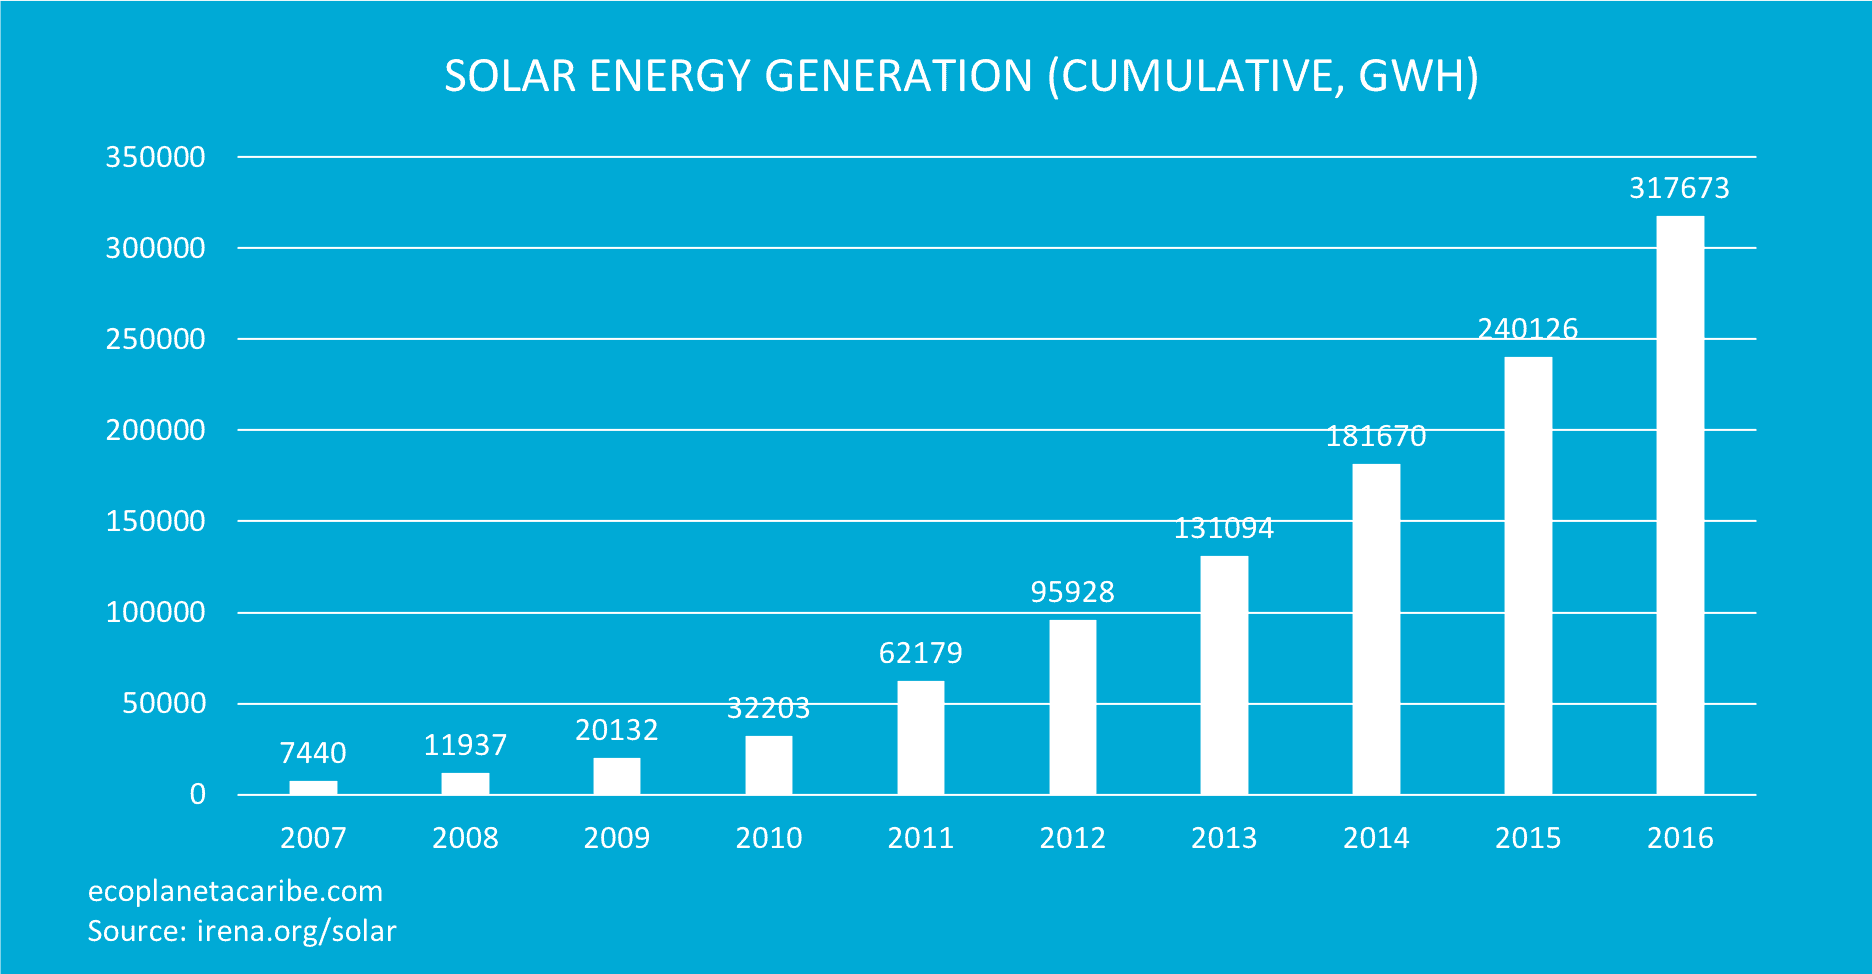
20. In 2017 Solar PV represents around 2,1% of the global electricity demand and 4% in Europe. [International Energy Agency].
21. In 2017 Solar PV represents around 4% of the electricity demand in Europe. [International Energy Agency].
Solar Energy Cost
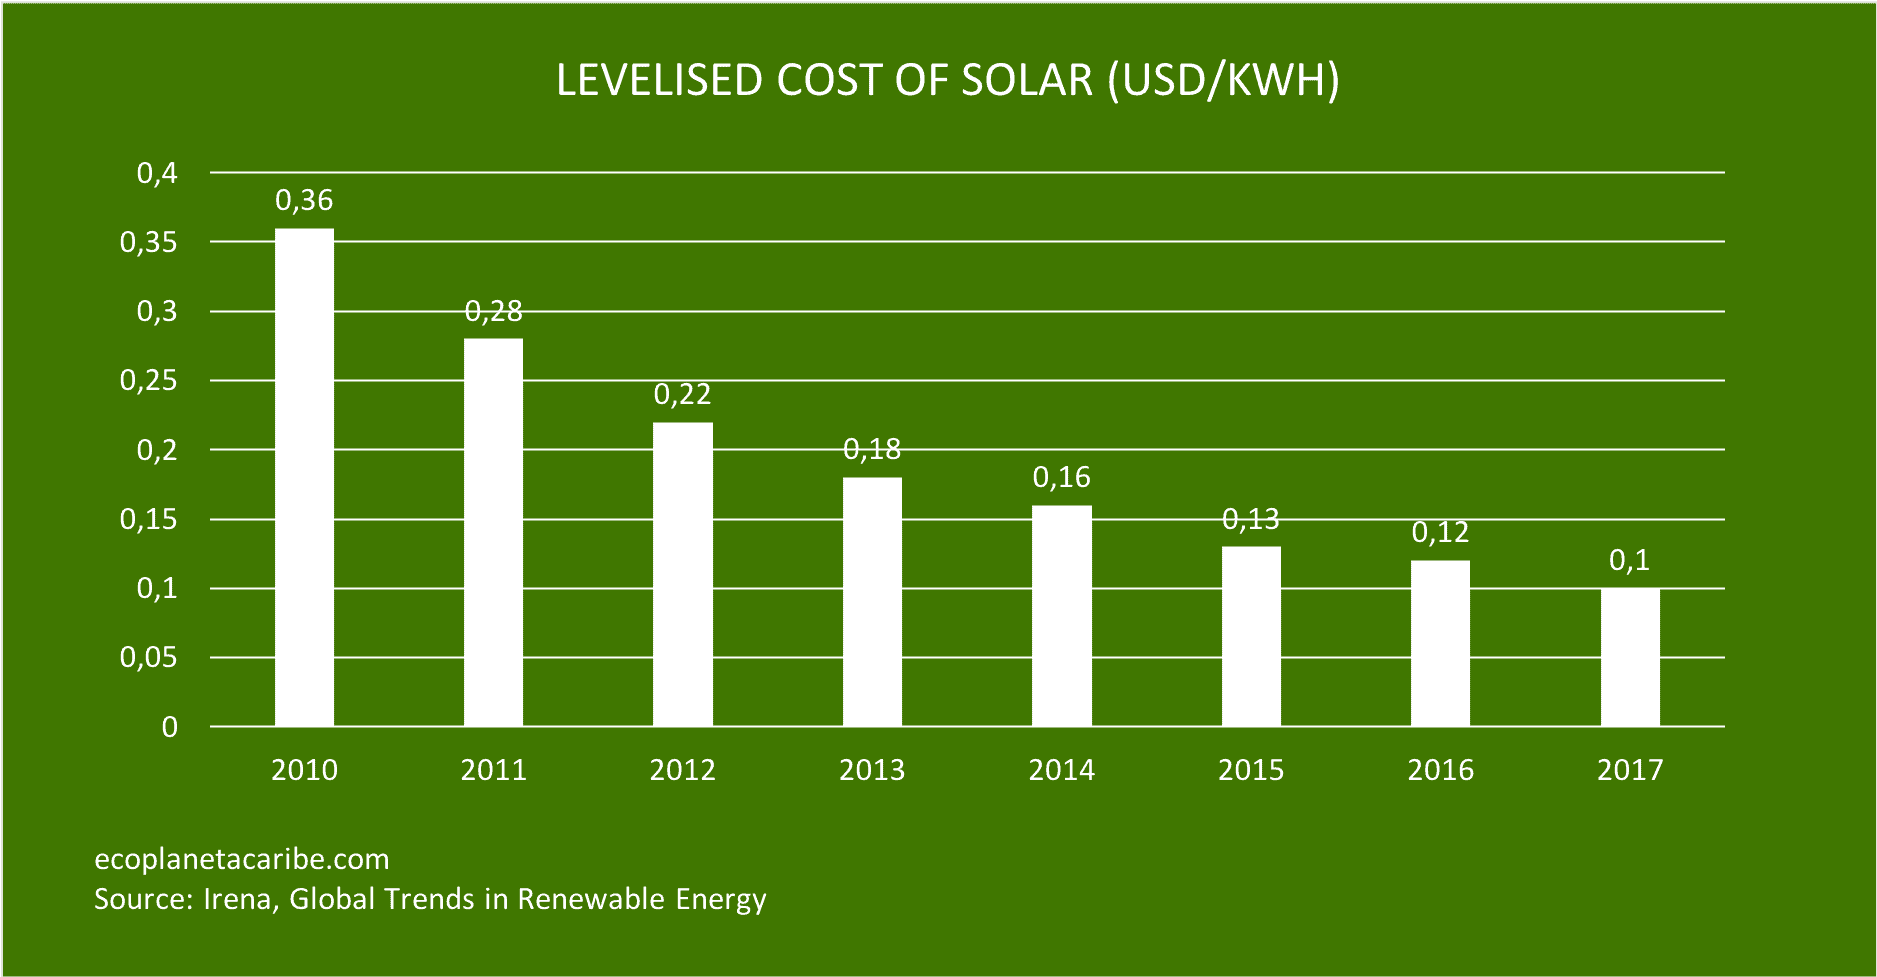
22. The levelized cost of solar energy was $0,1 per Kilowatt hour. That is almost 4 times less as in 2010.
23. In 2018 a 6 kW solar power system installed in the United States cost on average $13 188. [Energy Sage].
24. The lowest bid in a renewable energy auction ever for solar energy was 2,34 US Dollar cents per kWh [Clean Technica].
25. In 2017 the mean cost of energy produced by utility scale solar is $50 per megawatt hour. That is cheaper than coal ($102), gas ($60) and nuclear energy ($148) [Lazard].
26. In 2018 the pricing of solar pv inverters dropped 7% in comparison to the year before. [NREL].
Solar Energy Jobs
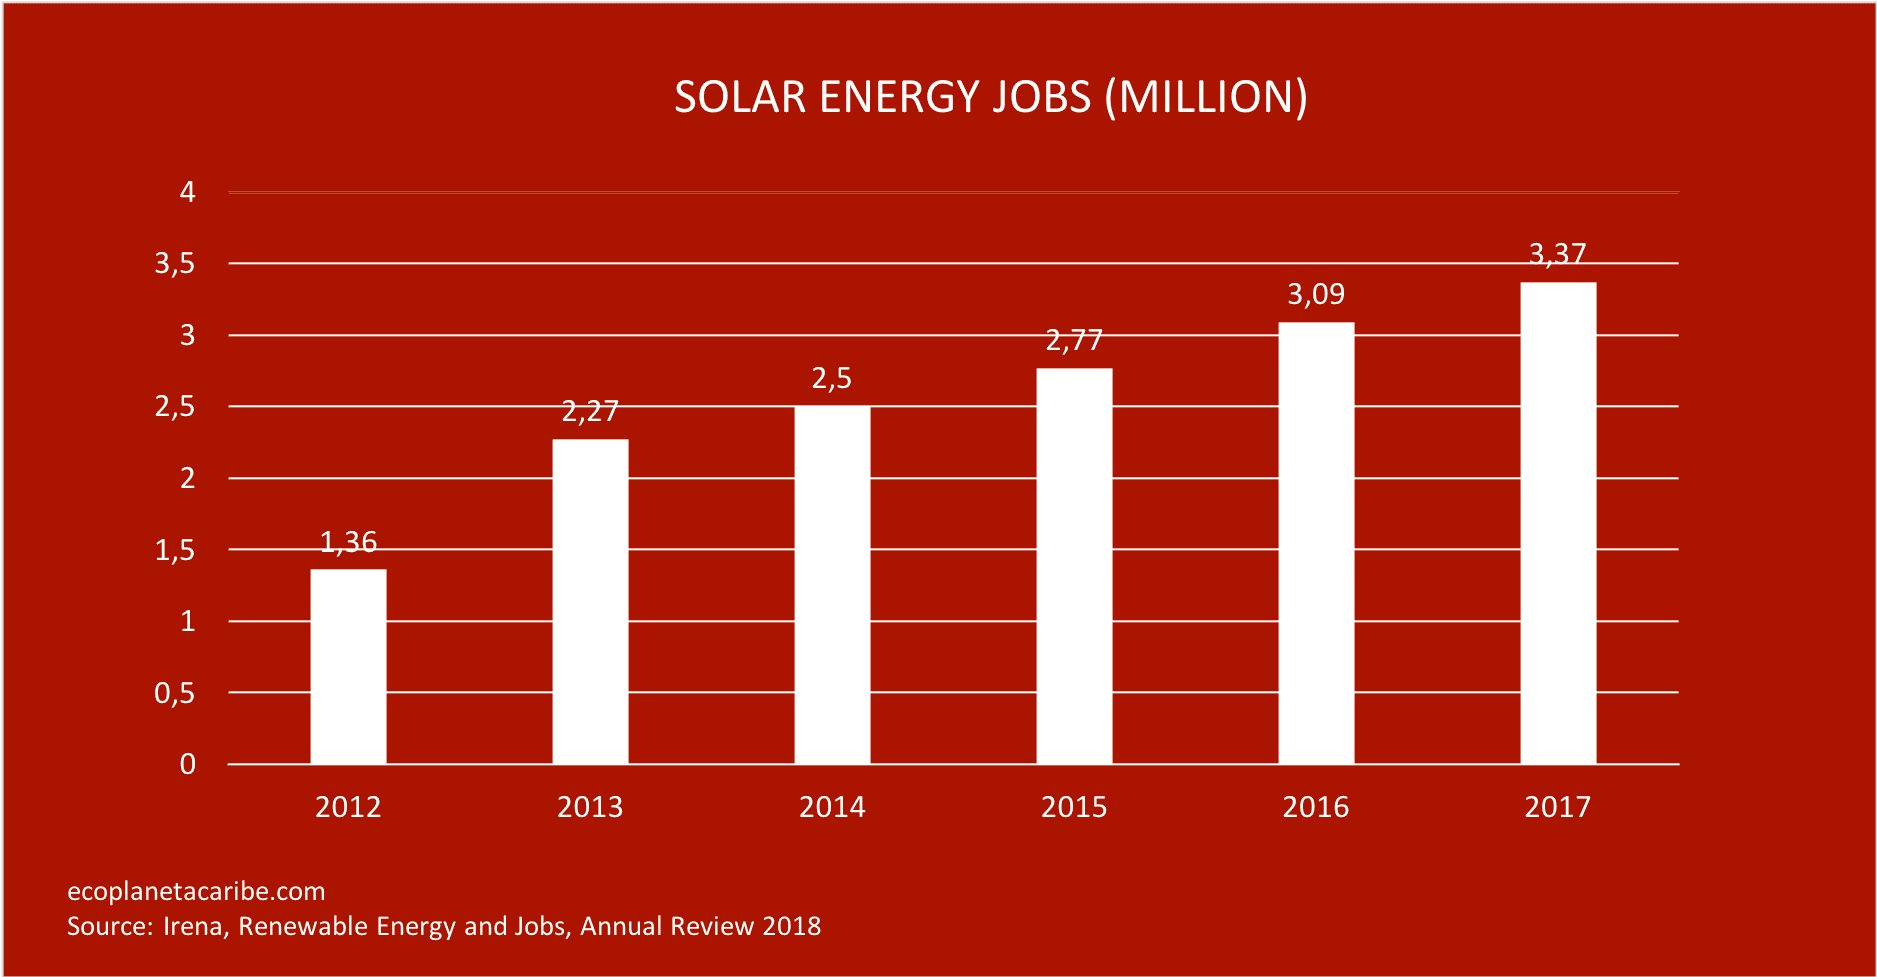
28. In 2017 65% of all the solar energy jobs in the world are located China. China has an estimated total of 2,2 million solar energy jobs [IRENA].
29. In 2017 the United States had a total of 250 000 jobs in the solar energy sector [IRENA].
30. In 2017 Japan had 271 500 solar energy jobs. Japan is ranked number 2 [IRENA].
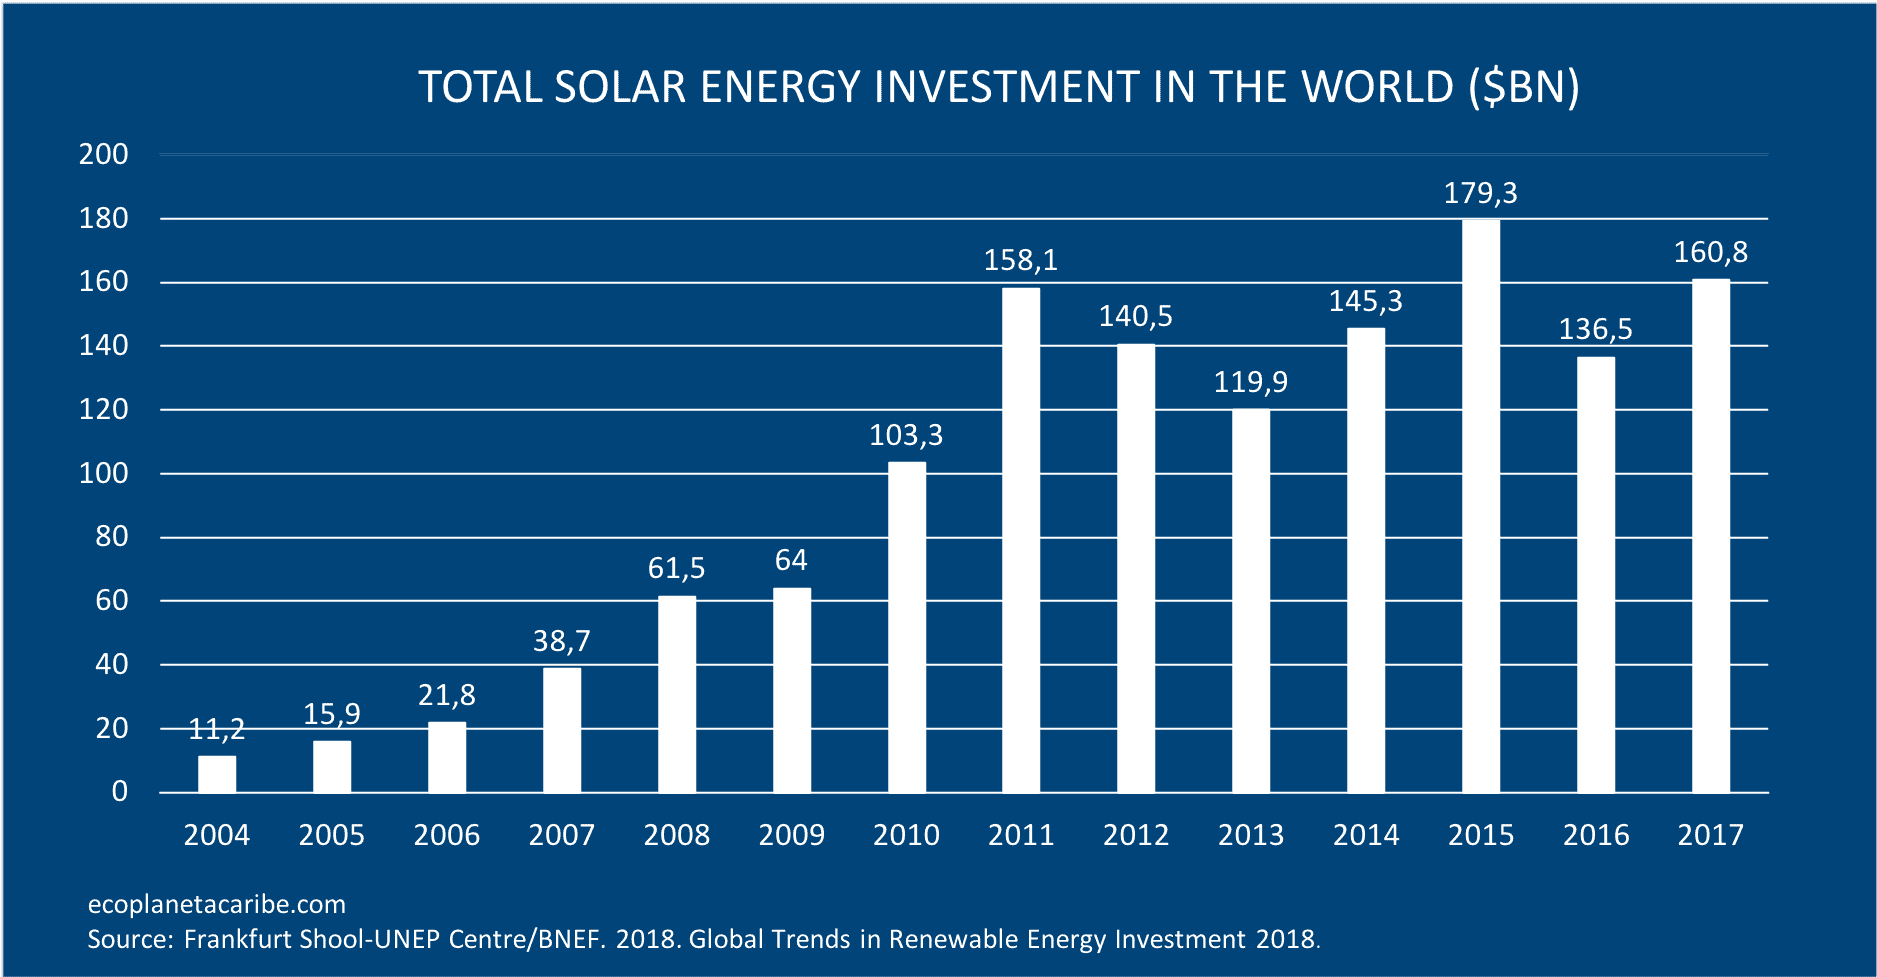
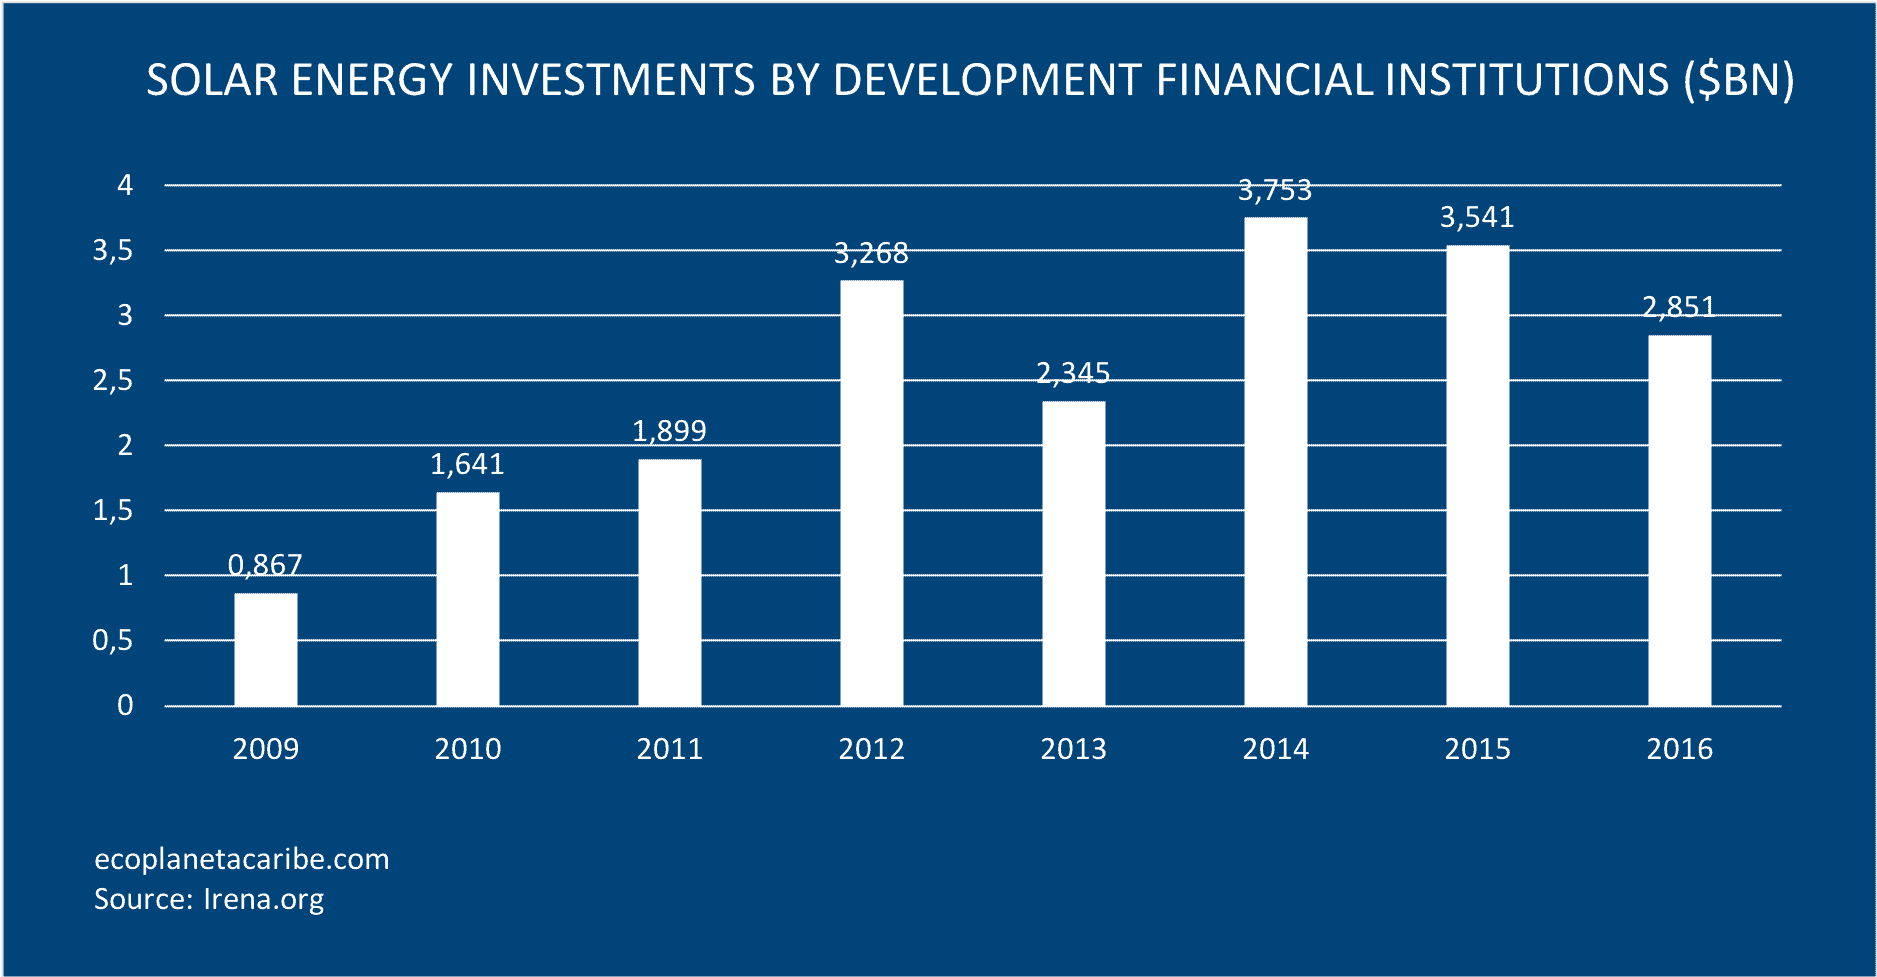
Solar Energy Investments
33. As of 2017 Sunnova Energy Group is the best funded solar energy company. It has raised $1,64 Billion in funding since it inception [CBinsights].
34. Octopus Investments has the biggest European solar energy portfolio. In 2017 it had a size of 1,080.00 Megawatt [Solar Asset Management Europe].
35. The top finance asset deal in 2018 was done by EIG Global Energy Partnes. It bought the Cerro Dominador solar energy project for $881 million [Bloomberg New Energy Finance].
36. The top private equity deal in 2018 was worth $200 million done by a Temasek-led group in the solar energy company Cypress Creek Renewables [Bloomberg New Energy Finance].
37. In 2016 the private sector invested $2.8 billion in research and development of solar pv [Frankfurt School-UNEP Centre/Bloomberg New Energy Finance].
38. In 2016 governments invested $2.0 billion in research and development of solar pv [Frankfurt School-UNEP Centre/Bloomberg New Energy Finance].
39. In 2017 publicly listed PV manufacturing companies invested together (20 companies) $967.28 million in research and development of solar PV [PV-Tech].
40. In 2017 the publicly listed PV manufacturing company LONGi invested more than $175.343 million in research and development of solar PV [PV-Tech].
Solar Energy Companies
41. The biggest solar pv developer in the world is the Chinese company GCL New Energy. It has deployed 5 gigawatts and has 7 gigawatts more in its pipeline [Greentech Media].
42. The biggest solar inverter company in the world by market share in shipments was Huawei. In 2017 it had a market share of 26.6% [PV Europe].
43. In 2017 the global market size of solar inverters was valued at $6 billion [Global Data].
44. The biggest solar pv manufacturer in the world in production volume was the Chines company Jinko Solar. In 2017 it produced 7 680 Megawatts of solar pv panels [PV Magazine].
45. In 2016 the global solar panel market size was valued at $30.6 billion [Zion Market Research].
46. In 2017 First Solar was the biggest solar developer in the US market. It installed a capacity of 7 650.50 Megawatt of solar energy [Energy Acuity].
47. The median gross margin of global PV manufactures in 2018 was 14% [NREL].
48. Most global PV manufactures reserve 1% of their revenue for future warranties. [NREL].
49. Most global PV manufactures a 10-year warranty for defects in materials and workmanship [NREL].
49. Most global PV manufactures a 10-year warranty for defects in materials and workmanship [NREL].
50. In 2018 the most efficient commercially available PV panels made by Sunpower had an efficiency of 22,2% [Energy Sage].